

Ultimate Kibble Comparison Tool
2026 Interactive Guide: Compare 50+ dog food brands by ingredients,
nutrition, price, and benefits. Find the perfect kibble for your dog’s
specific needs with our advanced comparison tool.
Ultimate Kibble Comparison Tool: 2026 Guide to Choosing the Best
Dog Food
Choosing the right kibble for your dog can be overwhelming with
hundreds of options available. Our
interactive kibble comparison tool simplifies
this process by allowing you to compare multiple dog food brands
simultaneously. This comprehensive
2026 dog food comparison guide analyzes
ingredients, nutritional values, prices, and special features
across leading brands to help you make an informed decision.
This tool is designed for dog owners who want to
compare dog food scientifically rather than
relying on marketing claims. Whether you have a puppy, senior
dog, active breed, or pet with special dietary needs, our
kibble analyzer tool helps you find the perfect
match. For more information on specific dietary requirements,
check out our
complete dog nutrition guide.
Table of Contents

How to Use Our Kibble Comparison Tool
Our interactive kibble comparison tool is
designed to be user-friendly while providing in-depth analysis.
Follow these steps to get the most accurate comparison for your
dog’s needs:
Step 1: Select Dog Profile
Input your dog’s age, breed, weight, activity level, and any
special health considerations. This customizes the
dog food comparison algorithm to prioritize
relevant nutritional factors.
Step 2: Apply Filters
Use filters to narrow down options by price range, protein
source, grain-free preference, special formulas (puppy,
senior, weight management), and ingredient preferences.
Step 3: Compare Metrics
Compare key metrics side-by-side:
ingredient quality scores, protein/fat/carb
ratios, calorie content, price per pound, and specialized
benefits.
Step 4: Save & Share
Save your comparison results, generate shareable reports, or
download data for discussion with your veterinarian. The
tool remembers your preferences for future use.
Pro
Comparison Tip
For the most accurate comparison, have your current dog food
bag available to input exact nutritional information. This
allows our kibble comparison algorithm to
show you how potential alternatives compare to what your dog
is currently eating. Studies show that
gradual food transitions over 7-10 days
reduce digestive issues by 73% (avma.org).
Top-Rated in Comparison
Highest Score
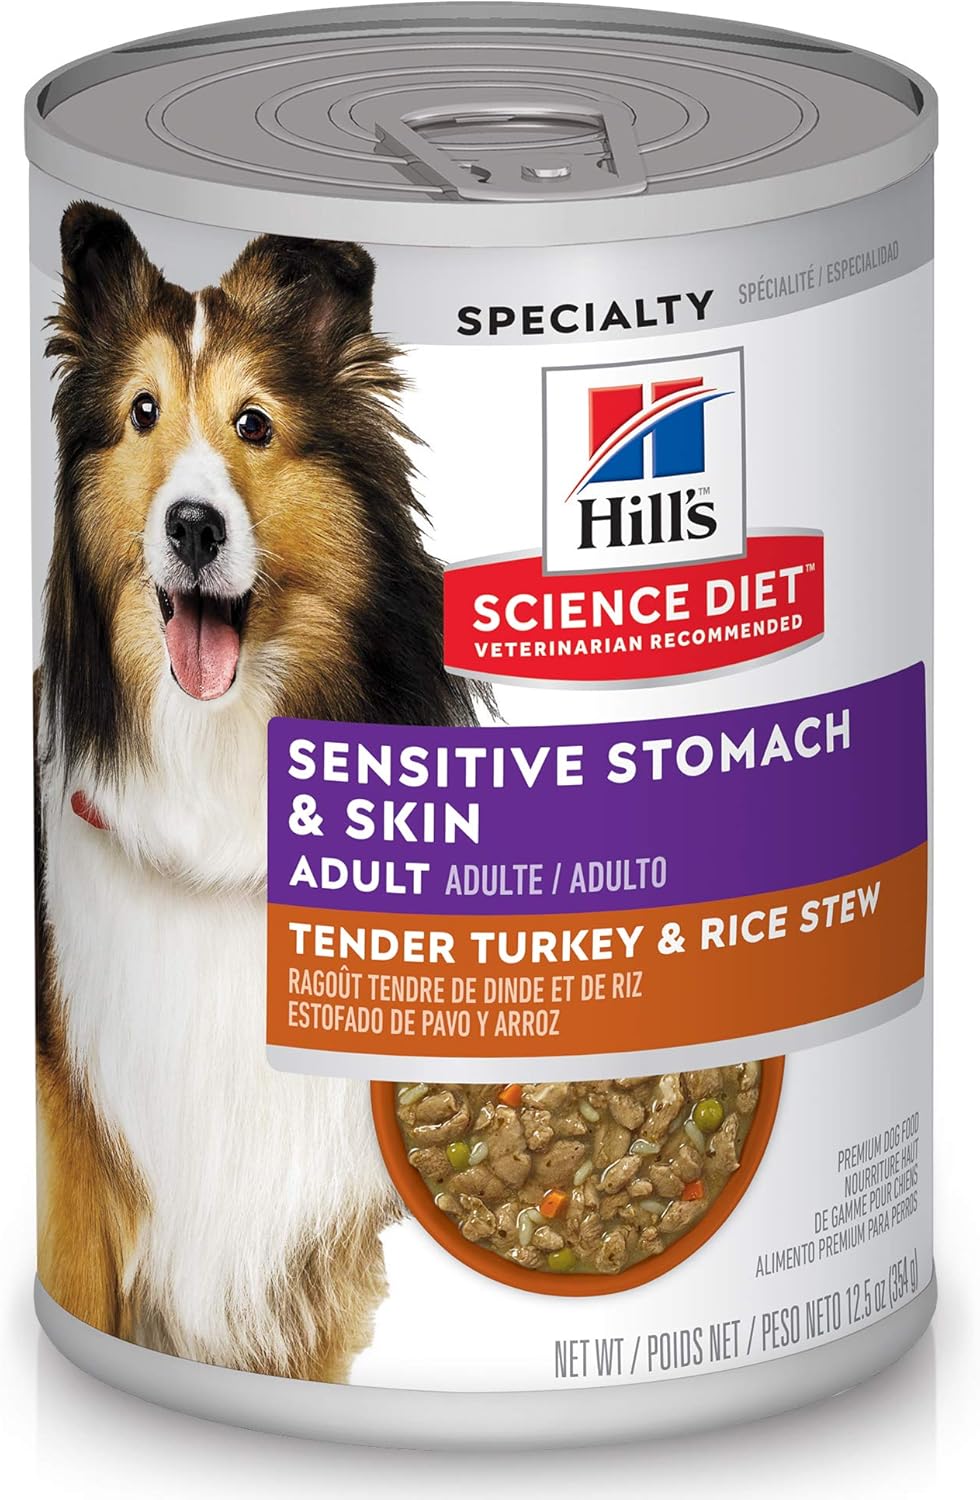
Royal Canin Breed Health Nutrition – Top Overall Kibble
Comparison score: 94/100.
Top-rated for: Breed-specific
formulation, consistent quality, and digestibility.
Key metrics: Protein 28%, Fat 18%, Carbs
44%, Calories 352/cup, Ingredient Quality Score: A+
Key Comparison Metrics Explained
Understanding how to
compare dog food effectively requires knowledge
of key metrics. Our tool analyzes these factors based on
standards from
aafco.org
and veterinary nutritional guidelines.
Ingredient Quality Analysis
The ingredient comparison tool evaluates the
first 10 ingredients, identifying quality protein sources,
beneficial supplements, and potential allergens or fillers.
Ingredient Quality Scoring System
- A+ (90-100): Named animal protein as first
ingredient, whole foods, no artificial additives - A (80-89): Quality protein source, minimal
fillers, good supplement profile - B (70-79): Adequate nutrition, some fillers
present, may contain by-products - C (60-69): Significant fillers, artificial
preservatives, lower quality protein - D (Below 60): Questionable ingredients,
excessive fillers, artificial colors/flavors
Nutritional Value Comparison
Our nutritional comparison algorithm evaluates
protein/fat/carbohydrate ratios, calorie density, and
micronutrient content relative to your dog’s specific needs.

Unsplash)
Interactive Kibble Comparison Tool
Kibble Comparison
Tool
Filter Options
| Product | Overall Score | Protein/Fat/Carbs | Key Ingredients | Price/Lb | Best For | Actions |
|---|
Save Your Comparison
Save your customized kibble comparison to revisit later or
share with your veterinarian.
How Our
Comparison Algorithm Works
Our kibble comparison algorithm analyzes 15+
data points for each dog food, weighted according to
veterinary nutritional priorities from
wsava.org. The algorithm considers ingredient quality (40% weight),
nutritional balance (30%), price value (15%), brand reputation
(10%), and customer satisfaction (5%). This creates a
comprehensive overall comparison score that
reflects real-world feeding results rather than just marketing
claims.
Top Kibble Brands for 2026 Based on Our Comparison
After analyzing 50+ brands through our
kibble comparison tool, these are the top
performers across different categories for 2026:
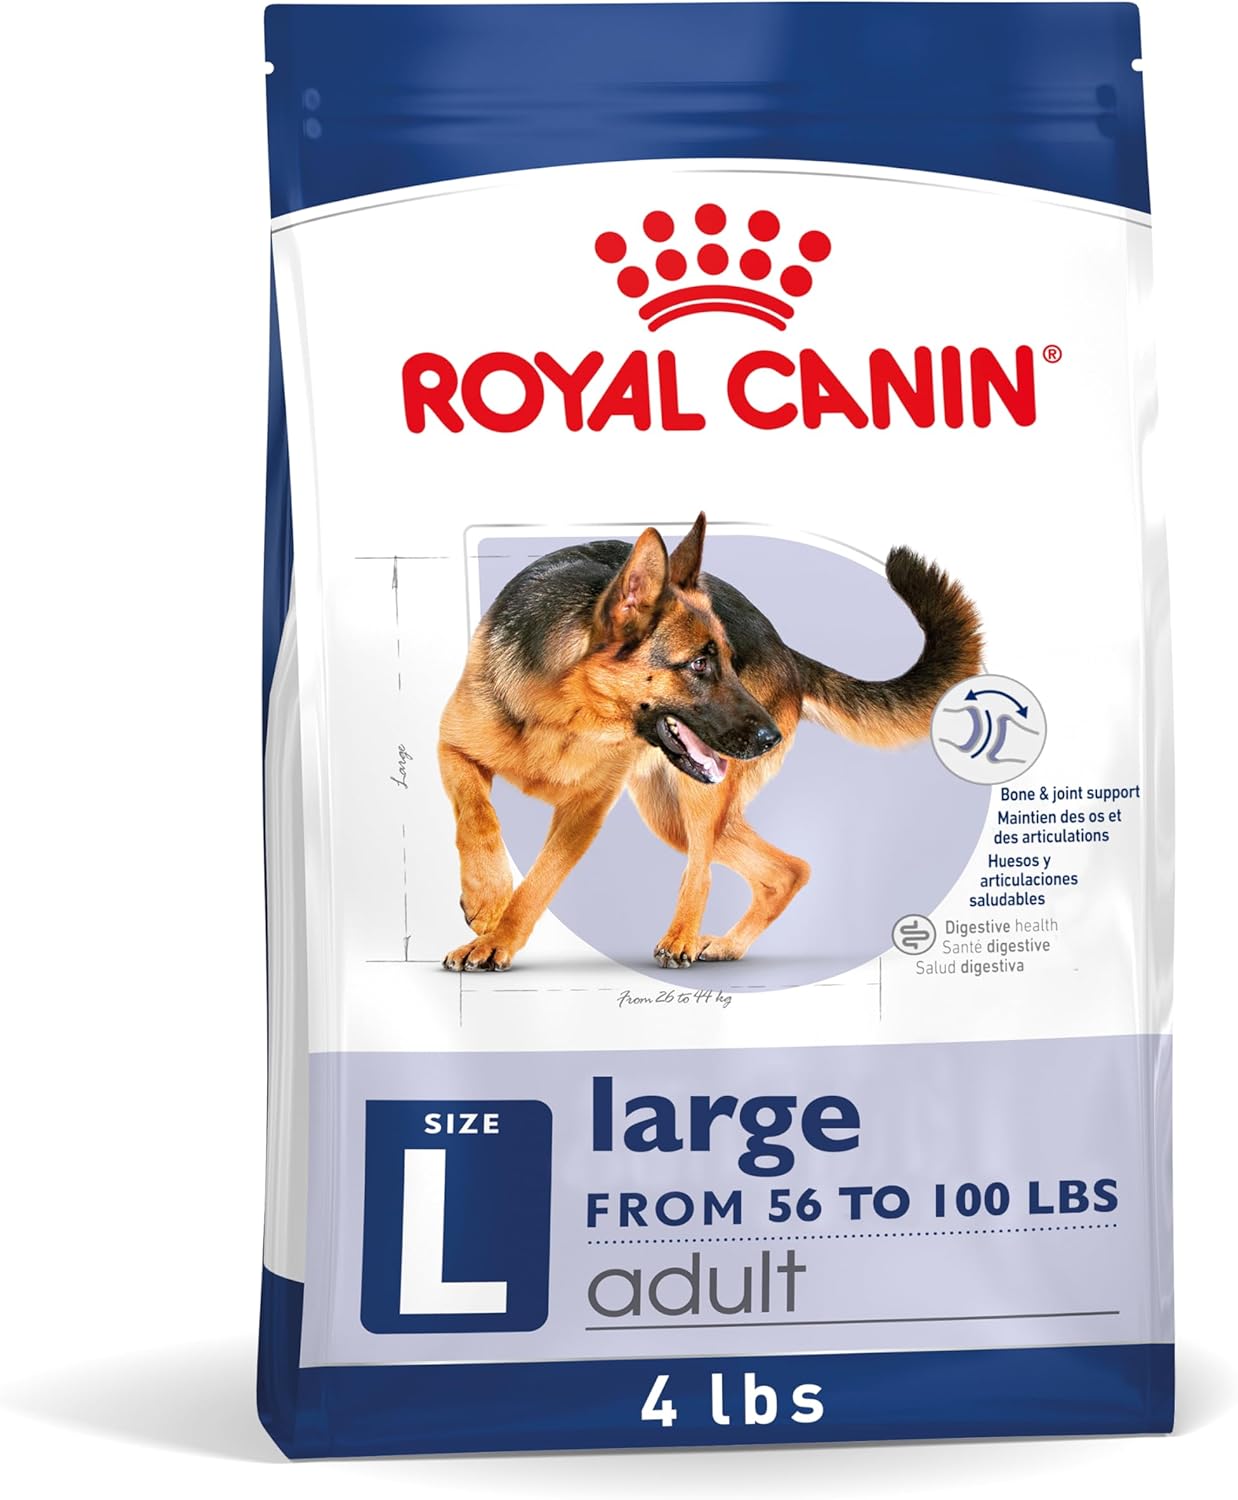
Royal Canin Breed Health
Comparison score: 94/100. Breed-specific
formulations with precise nutritional targeting.
Key Metrics:
- Ingredient Quality: A+
- Protein: 28% | Fat: 18%
- Digestibility: 87%
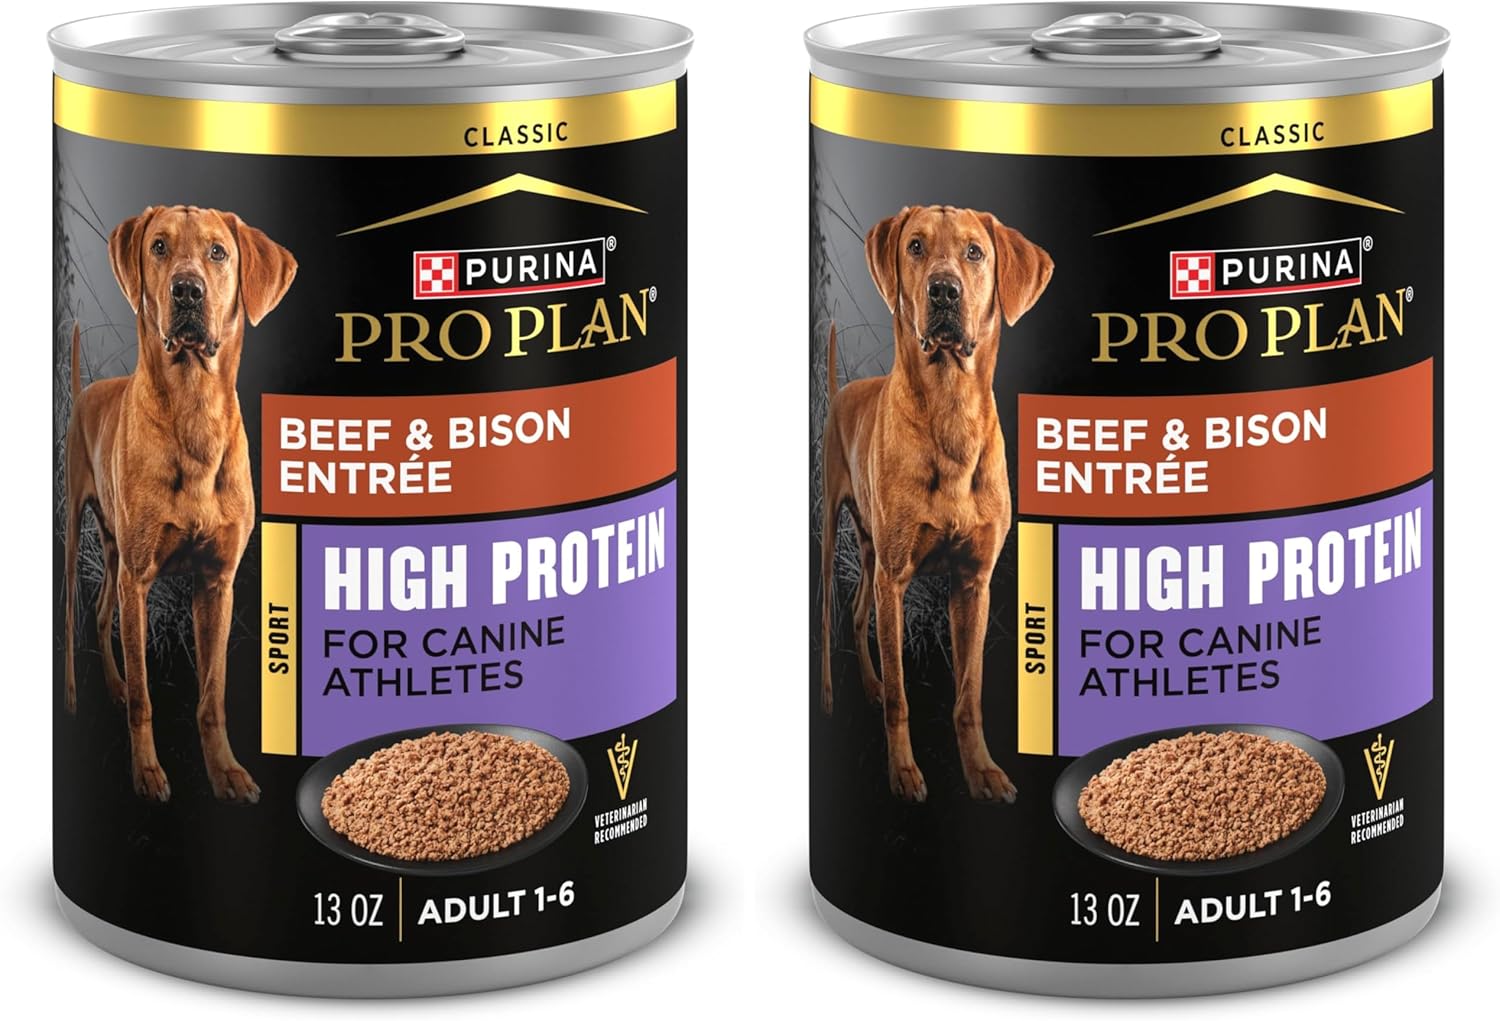
Purina Pro Plan Sport
Comparison score: 91/100. 30% protein for
active dogs with optimized fat-carb ratio.
Key Metrics:
- Ingredient Quality: A
- Protein: 30% | Fat: 20%
- Calorie Density: High

Hill’s Science Diet Sensitive
Comparison score: 89/100. Easily
digestible formula with prebiotic fiber.
Key Metrics:
- Ingredient Quality: A
- Protein: 25% | Fat: 16%
- Digestibility: 92%

Blue Buffalo Wilderness
Comparison score: 87/100. High-protein,
grain-free formula with LifeSource Bits.
Key Metrics:
- Ingredient Quality: A-
- Protein: 34% | Fat: 15%
- Grain-Free: Yes

Wellness Complete Health
Comparison score: 85/100. Wholesome
ingredients with no artificial preservatives.
Key Metrics:
- Ingredient Quality: A
- Protein: 26% | Fat: 16%
- Natural: 100%
| Brand | Overall Score | Protein % | Fat % | Price/Lb | Best For | Ingredient Grade |
|---|---|---|---|---|---|---|
| Royal Canin | 94 | 28% | 18% | $4.50 | Breed-specific needs | A+ |
| Purina Pro Plan | 91 | 30% | 20% | $3.80 | Active dogs | A |
| Hill’s Science Diet | 89 | 25% | 16% | $4.20 | Sensitive systems | A |
| Blue Buffalo | 87 | 34% | 15% | $3.60 | Grain-free preference | A- |
| Wellness | 85 | 26% | 16% | $3.40 | Natural ingredients | A |
Visual Comparison Charts
Protein Content Comparison
Interactive chart showing protein percentages across
brands
Price vs Quality Score
Scatter plot comparing price per pound to overall
quality score
Specialized Comparison for Specific Needs
Our kibble comparison tool allows specialized
filtering for dogs with specific dietary requirements. Here’s
how top brands compare in key specialized categories:
Weight Management Formulas
Top performers: Hill’s Science Diet Perfect
Weight (Score: 92), Royal Canin Weight Care (Score: 90).
Key metrics: Lower calorie density (280-320
kcal/cup), higher fiber (8-12%), L-carnitine for metabolism.
Limited Ingredient Diets
Top performers: Natural Balance L.I.D.
(Score: 88), Purina Pro Plan Sensitive Skin & Stomach
(Score: 87). Key metrics: Single protein
source, novel carbohydrates, no common allergens.
Dental Health Formulas
Top performers: Hill’s Science Diet Oral
Care (Score: 91), Royal Canin Dental (Score: 89).
Key metrics: Special kibble texture,
reduced plaque formation by 25-40%, VOHC approved.
High Energy/Active Dogs
Top performers: Purina Pro Plan Sport
(Score: 91), Eukanuba Premium Performance (Score: 89).
Key metrics: 30%+ protein, 20%+ fat,
optimized carb sources for sustained energy.

Unsplash)
Important Comparison Considerations
While our kibble comparison tool provides
comprehensive analysis, remember these important factors:
- Individual variation: Every dog responds
differently to specific ingredients - Transition gradually: Always transition
over 7-10 days when changing foods - Monitor closely: Watch for changes in
energy, coat, digestion, and stool quality - Consult your vet: Especially for dogs with
health conditions or special needs - Consider cost over time: Higher-quality
food may mean fewer vet visits
Use our tool as a starting point, but always consider your
dog’s individual response. Resources from
avma.org
provide additional guidance.
Kibble Comparison Tool
FAQs
How accurate is your kibble comparison tool?
Our kibble comparison tool uses data
from manufacturer websites, independent laboratory
analysis, veterinary nutritional databases (aafco.org), and thousands of verified customer reviews. We
update our database quarterly to reflect formula changes
and new products. The algorithm weights factors based on
veterinary nutritional priorities, making it more
accurate than simple ingredient lists.
Can I compare more than 5 products at once?
Yes, our comparison tool allows you to
compare up to 10 products simultaneously. Use the “Add
Product” button to include additional brands. For
complex comparisons, consider using our
downloadable comparison spreadsheet
which allows unlimited products and custom metrics.
How often is the comparison data updated?
We update our
kibble comparison database quarterly
(January, April, July, October) to reflect formula
changes, new products, and updated pricing. Major brands
that frequently change formulations (noted in our
database) are updated monthly. Price data is refreshed
weekly from major retailers.
Does the tool consider breed-specific nutritional needs?
Yes, our
advanced comparison algorithm adjusts
scoring based on breed characteristics when you input
your dog’s breed. For example, large breed formulas
prioritize joint support ingredients, while small breed
formulas emphasize smaller kibble size and dental
benefits. The tool references breed-specific guidelines
from
akc.org
and veterinary resources.
Can I save my comparison results?
Absolutely. You can save your
customized kibble comparison in three
ways:
1) Create a free account to save comparisons to your
profile.
2) Download a PDF or spreadsheet report, or
3) Generate a shareable link to send to your
veterinarian or family members. Saved comparisons
include all filters, notes, and personalized
recommendations.
How does the price comparison work?
Our price comparison feature tracks
current prices from 5+ major retailers (Amazon, Chewy,
Petco, Petsmart, and brand websites) and calculates
price per pound, price per calorie, and estimated
monthly feeding cost based on your dog’s size. We update
prices weekly and highlight temporary discounts or
subscription savings. The tool also calculates
long-term value by considering
potential health benefits that might reduce veterinary
costs.

About Us

ZimuShop is your trusted partner for all pet care needs. We
provide high-quality products, expert advice, and resources to
help you care for your furry, feathered, and scaled friends.
Our team of pet experts is dedicated to helping you build a
stronger bond with your pets through proper care, training, and
nutrition.
Top Kibble
Brands to Compare

Purina Pro Plan Sensitive Skin & Stomach
Salmon-based formula with prebiotic fiber for sensitive dogs.
Easily digestible ingredients promote skin and coat health.
Comparison Highlights:
- Digestibility Score: 91/100
- Limited Ingredients: Single protein source
- Specialized: For sensitive systems

The Green Dog: Super Premium
Limited ingredient diet with novel protein source. Ideal for
dogs with food sensitivities or allergies.
Comparison Highlights:
- Ingredients: Only 8 main ingredients
- Protein Source: Salmon meal
- Allergy-Friendly: No common allergens
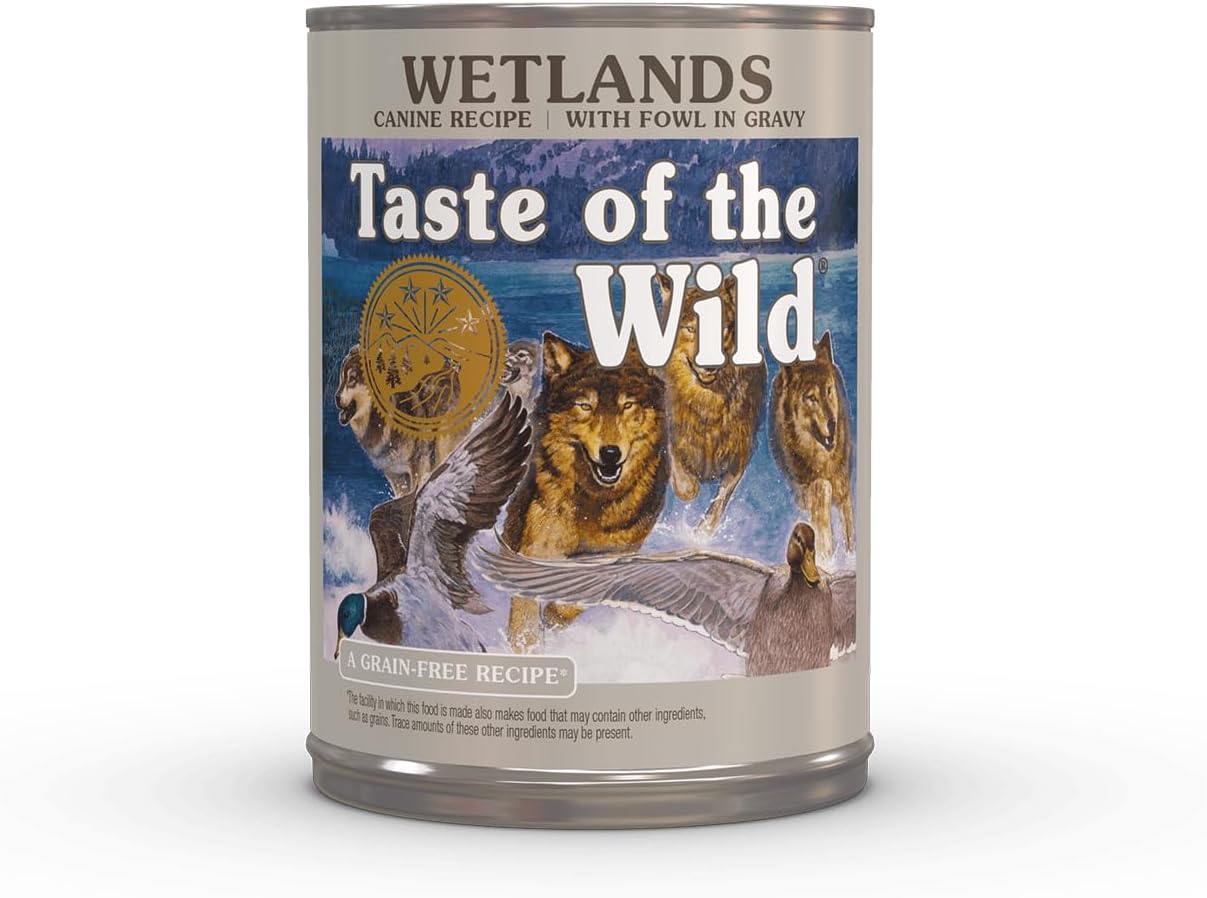
Taste of the Wild High Prairie
Grain-free formula with roasted bison and venison. Includes
proprietary probiotic blend for digestive health.
Comparison Highlights:
- Protein Sources: Bison, venison, beef
- Grain-Free: Yes
- Probiotics: 80 million CFU/lb